DESCRIPTION
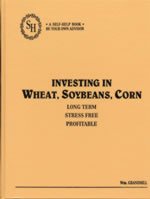
(From The Text) – The keys to forecasting the future price of grains are the new Forecasting Graphs, or Forecasting Charts as they are sometimes called. They were produced specifically for this book. The Forecasting Graphs are designed to tell you whether you should buy or sell, or stay out of the market. The charts are based on the world’s supply and demand for wheat, soybeans, and corn, the only reliable indicator of prices. All varieties of weather and economic conditions are incorporated into the graphs. The grain data of the past 15 years was used, and during that time there was a good variety of droughts, bumper crops, recessions, and good times. All of these conditions are in the graphs.
There is no technical trading in this book, such as moving averages, RSI, etc. Technical trading would require you to spend about 20 minutes a day updating your charts and records. It is doubtful that you will spend 20 minutes a month when using this book.
This book will introduce you to a method of trading which is relaxed, stress free, safe and profitable. The unique Forecasting Graphs will enable you to estimate the price of wheat, soybeans, and corn months in advance, and know whether you should buy or sell when the right time comes.